Can your teen spot deceptive data in under 10 seconds?
Give your teen a simple skill for spotting misleading data, charts, and graphs
before they believe them.
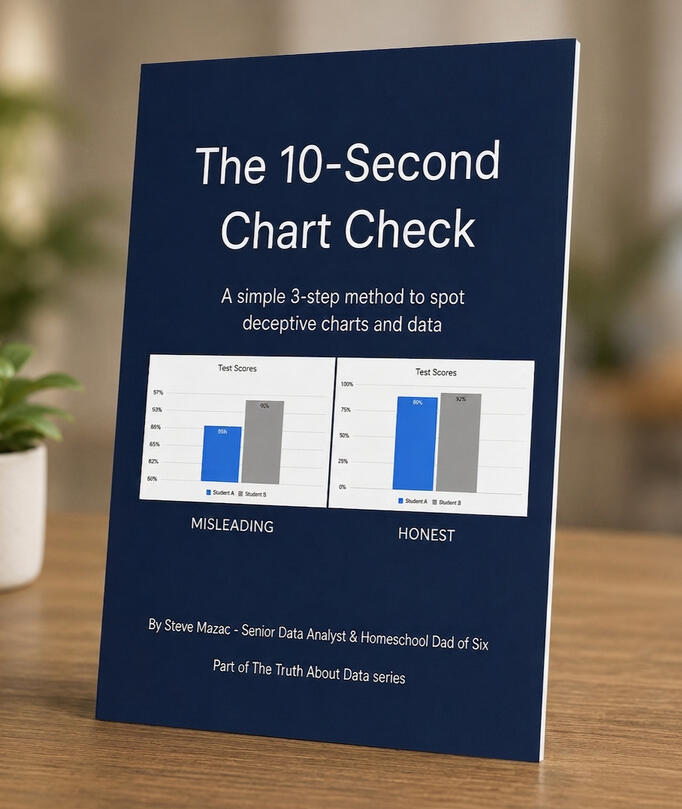
The 10-Second Chart Check is a free, practical guide designed for homeschool teens ages 13–18.One download. One conversation tonight. A critical-thinking skill they can use for life.No statistics background required.
I have spent more than ten years of my life building reports and dashboards inside corporate America.I know how someone can:
- make a number look bigger than it is by adjusting an axis.
- make a flat trend look like growth by trimming the chart.
- bury key information behind an impressive-sounding percentage.And until recently, I had never once sat down with my own six kids and explained any of it.My oldest is eighteen now. She spends more time online than I did at her age (because there was no internet when I was eighteen). She sees charts regularly, on social media, in news stories, in YouTube videos that look authoritative but aren't, in AI-generated content that's getting harder to distinguish from real reporting every month.
She is very sharp and has always read well above grade level.
But, she had no idea how to read a chart critically.
Nobody ever showed her, because this isn't something most of us were taught as kids ourselves.If you've ever caught yourself wondering whether your teen actually knows how to evaluate what they're seeing online, or if they're just absorbing whatever number shows up on screen first, this guide is where I'd start with mine tonight.Three checks your teen can run on any chart before they decide whether to believe it. Once they learn them, it only takes ten seconds to use them.No data or statistics background required for either of you.That's why I built this free chart check.
Free PDF • Designed for homeschool teens • Takes minutes to learn
Homeschooling in Florida? This pairs perfectly with standards-aligned electives you can get reimbursed through Step Up For Students.
⭐⭐⭐⭐⭐
"Overall, I really like it and have already learned a lot…in 10 seconds." Danielle H. - Classical Conversations Homeschool Mom
A Chart Can Look Like the Truth.
A graph can make a tiny difference look enormous.
A carefully chosen starting point can completely change the story.
A percentage can sound impressive without telling you what actually happened.
Charts and statistics can make almost any claim look convincing.
Your teen will encounter these techniques constantly;
in social media, news stories, advertisements, political arguments,
school assignments, and AI-generated content.
The problem isn't that your teen needs to become a statistician.
They need to know what questions to ask. That's what the 10-Second Chart Check teaches.
Try This With Your Teen
Show your teen this chart.
Don't explain it.
Don't tell them what's wrong.
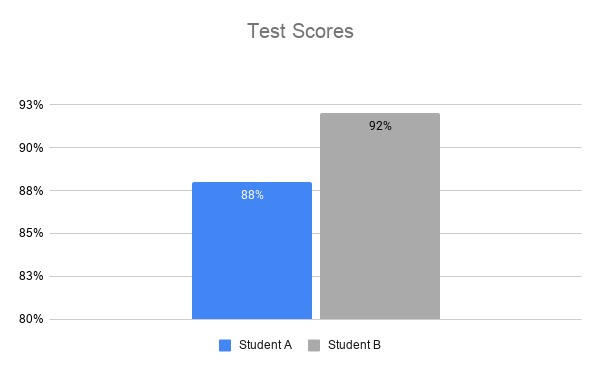
Then
just ask:
"What do you notice?"
Can they tell whether the chart is giving them an accurate picture?
Can they spot something that seems unusual?
Do they know what question to ask next?
If they're not sure, that's completely normal.Most of us were never taught a simple method for evaluating charts.
The 10-Second Chart Check gives them one.
Meet the 10-Second Chart Check
3 simple checks your teen can use to quickly examine almost any chart, graph, or infographic.
Instead of immediately accepting what a chart appears to show, your teen learns to pause and check three things.
1 - CHECK
THE AXIS
2 - CHECK
THE TIMEFRAME
3 - CHECK
WHAT'S MISSING
Together, these three checks give your teen a simple habit:
Don't just look at the chart. Check the chart.
What Your Teen Will Be Able to Do
After learning the 10-Second Chart Check,
your teen will have a practical tool they can use whenever someone presents them with data.
Spot
Red Flags
Recognize common warning signs that a chart may be exaggerating, hiding, or distorting what the data actually says.
Ask Better Questions
Instead of automatically accepting a chart's message, know what to investigate before deciding whether it's trustworthy.
Think More
Critically
Build a real-world critical-thinking habit that applies far beyond math class.
Use It
Anywhere
News. Social media. Advertisements. Schoolwork. Political claims. AI-generated content. Everyday conversations.
⭐⭐⭐⭐⭐
"Super helpful and needed. We see so much data come across our feeds and news
and learning to stop and check before we believe and dive into the data will really help!"
Amanda R. - Homeschool Mom
No Statistics Degree Required
❌ No boring stats lecture
❌ No endless academic content
❌ No generic fact-checking list
❌ No prior knowledge required
This isn't about turning your teen into a statistician.
It's about helping them become harder to fool.
The Data They'll See After They Leave Home
Won't Come With an Answer Key.
Your teen is growing up in a world filled with numbers.
"Sales increased 300%."
"This treatment reduces
risk by 50%."
"Students who do X are twice as likely to succeed."
"9 out of 10 people agree."
"Crime is up 40%."
Some of these claims may be accurate. Some may be misleading.
Or, they might be technically true while creating a completely wrong impression.
Your teen needs to know the difference, and The 10-Second Chart Check is a simple place to start.
Made for Homeschool Families
The 10-Second Chart Check is especially useful for:
Homeschool Parents
Who want to add practical data and media literacy to their teen's education.
Teens Ages 13–18
Who are beginning to encounter increasingly sophisticated claims involving statistics, charts, research, and data.
Parents Who Want More Than Memorization
Information isn't enough.
Your teen also needs to know when information deserves to be questioned.
Families Looking for Real-World Learning
Something your teen can use at the kitchen table today and continue using long after high school.

I’ve spent 10+ years as a senior data analyst and directed both Challenge I and Challenge II in our local Classical Conversations community. My most important job is homeschooling my six kids.They are learning how to spot logical fallacies in written and oral arguments, but I want them to also know how to spot deception in charts and data in the media.One download. One conversation tonight.
Critical thinking skills they will use for life.
Your Free 10-Second Chart Check Includes
The 10-Second Chart Check PDF
A practical guide your teen can work through in minutes.
A Simple 3-Step Framework
A repeatable process for examining charts and graphs.
A Conversation Starter
Use the guide to turn a chart you encounter into a quick critical-thinking exercise with your teen.
What Other Homeschool Families Are Saying
⭐⭐⭐⭐⭐
"Noah and I reviewed the charts. I was impressed he was able to analyze the problems with the charts. It was fun."
Rosemary B. - Homeschool Mom
⭐⭐⭐⭐⭐
"So that’s totally cool!!! I just learned something as well as Jake!"
Amanda R. - Homeschool Mom
⭐⭐⭐⭐⭐
"Simple, quick, easy to understand"
"This is great information to share and teach."
"How come this isn’t a thing?"
Ashley B. - Homeschool Mom
One download. One conversation tonight.
The thinking skills your teen builds from this will last a lifetime.Florida families: This free guide is a sample of standards-aligned content you can get fully reimbursed through Step Up For Students.
No cost. No statistics degree required. Just a practical skill your teen can start using today.